Overview
Context
BestInvest wanted a way for retail investors to see how their money could grow — without jargon, without overpromising, and without slowing down a high-traffic marketing site.
I built Grow My Money, their public compound growth simulator: lump sum and monthly inputs, a target growth rate, optional fees and inflation adjustments, and a live chart that projects value over decades. BestInvest already had a similar experience behind login — this was the public-facing companion, built to the same standard for marketing traffic.
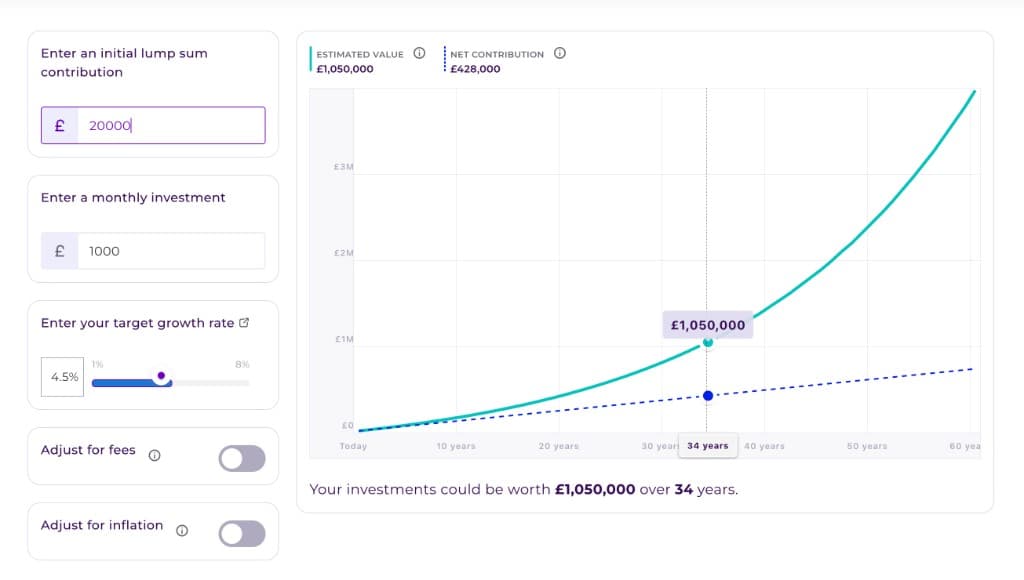
The overview above is the shipped design — inputs on one side, a scrubbable projection chart on the other, estimated value and net contribution updating as you explore the timeline.
What shipped
- Input panel — initial lump sum, monthly contribution, target growth rate slider, and toggles to adjust for fees and inflation
- Live projection chart — estimated value and net contribution plotted over a multi-decade timeline, with cursor scrubbing to explore any year
- Headline summary metrics — estimated value and net contribution surfaced above the chart and in the footer narrative
- Trust layer — tooltips, assumption modals, and a regulatory footer disclaimer
- Conversion CTAs — clear next steps alongside the chart
Challenge
- Turn a complex financial dataset — projections, growth scenarios, contribution totals — into something fast, responsive, and accessible, not a wall of numbers
- Integrate BestInvest's existing charting library with custom projection logic; research and trial different approaches until animation, scrubbing, and recalculation worked together cleanly
- Match the quality bar of a logged-in product feature on a public marketing surface, where performance and first impressions matter more
- Make a heavy interactive chart feel natural on touchscreen and mobile — genuinely difficult with rich charting libraries, and non-negotiable for a retail investor audience
- Keep layout and motion pixel-precise across breakpoints while inputs trigger live recalculations on every change
- Communicate financial assumptions without eroding trust on a regulated wealth platform
Approach
- Structured the flow so assumptions come first and the chart responds live — users build confidence before interpreting the output
- Leaned on the chart library's native animation and interaction where possible, with custom logic only where the product needed it
- Kept projection logic server-side — I focused the frontend on rendering and exploration, not hand-rolled financial maths
- Wired growth rate, fees, and inflation toggles into the same recalculation loop so every control felt immediate
- Surfaced every assumption through tooltips and modals, with explicit regulatory copy where projections could be misread
- Tuned responsive layout and render budgets so the chart stayed smooth on real devices
Outcome
- Grow My Money live on BestInvest — a touch-friendly simulator with complex charting and no performance compromise
- BestInvest's charting stack integrated cleanly rather than replaced with a one-off parallel build
- Investors can scrub decades of projected growth and compare estimated value against net contribution at any point
- Assumption-heavy financial UX that still reads clearly on a regulated, high-traffic marketing site